ChartPixel Reviews:AI-assisted data analysis tools
About ChartPixel AI
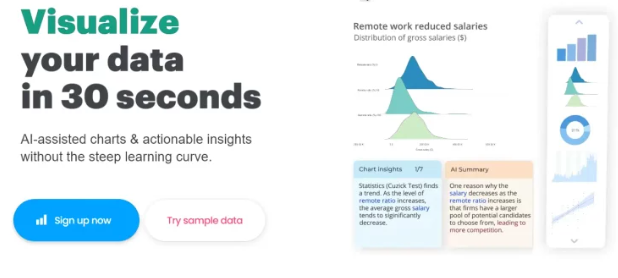
ChartPixel is an AI-powered data visualization and analysis tool that makes it easy to gather insights from your data. Just upload your spreadsheet or import data from a website and ChartPixel will instantly generate an interactive gallery of beautiful charts and graphs along with explanatory written insights.
ChartPixel aims to demystify data and analysis, making it accessible to everyone, regardless of skill level. The tool provides instant charts and AI-assisted insights, helping users understand and present their data effectively. It automates the process of data analysis, from selecting relevant columns and chart types to cleaning messy data and generating written insights. ChartPixel also offers features like keyword search, data upload from various sources, and the ability to customize and export charts and presentations.
Data visualization tool that enables users to effortlessly transform raw data into insightful and visually appealing charts.
ChartPixel Features
Introducing ChartPixel – Your Data Visualization Partner. With AI-assisted annotations and instant visualization, it simplifies data analysis and presentation creation for users of all skill levels.
Key Features and Highlights:
- Instant Visualization: Say goodbye to manual chart creation. ChartPixel automatically transforms your raw data into a variety of explained charts and summary insights. It enhances data comprehension instantly.
- Smart Data Analysis: Let AI handle the data complexities. ChartPixel auto-selects relevant columns, tidies up messy data, and suggests meaningful features for comprehensive data interpretation.
- From Raw Data to Presentation: Seamlessly convert your data insights into visually impressive and statistically accurate PowerPoint presentations. Craft compelling narratives with ease.
- Web Data Integration: Broaden your analysis horizons. Utilize ChartPixel’s keyword search tool to find and integrate web data into your charts, enriching your data-driven stories.
User Benefits:
- Effortless Visualization: No more struggling with complex data analysis tools. ChartPixel simplifies the process, making data visualization accessible to all.
- Smart Insights: AI-powered data analysis ensures that you’re focusing on the most relevant aspects of your data for better decision-making.
- Stunning Presentations: Turn data into compelling presentations effortlessly, impressing your audience with both visuals and insights.
- Web Data Integration: Expand your analysis with external data sources, providing a more comprehensive view.
Summary:
ChartPixel is your partner in simplifying data analysis and visualization. It empowers users of all skill levels to effortlessly create insightful charts from raw data. With AI-assisted annotations, instant visualization, and web data integration, ChartPixel revolutionizes the way you work with data, making it both accessible and actionable. Say hello to a new era of data-driven decision-making with ChartPixel.
Tools similar to ChartPixel
Rewind – a personalized AI powered by everything you’ve seen, said, or heard
Graphy –
Bit.ai
Saga
Meet Shepherd
Praxy AI – A Google Chrome Extension for students productivity.
Gamma App-A tool to create interactive content.
MagicBrief-A tool for creating and planning ads for social media.
Timely